Stock market volatility has remained high as investors continue to closely track COVID-19 containment efforts while getting a glimpse into how damaging travel restrictions, stay-at-home orders, and social distancing have been on the US economy. We continue to watch for signs of a peak in new cases in the United States, which would allow investors to start thinking about a resumption of economic activity and a potentially powerful economic rebound in the second half of this year. In the meantime, stocks may revisit the March lows.
WHERE WE ARE
The war against the COVID-19 pandemic continues this week as the number of new cases and deaths continues to grow. We were reminded last week how deadly COVID-19 may be when the White House told us the US death toll may eventually exceed 200,000. Globally, the case count passed one million people, with one quarter of those here in the United States. We will get through this crisis, as we have all others, but it’s a painful one, and it’s tough to see the other side.
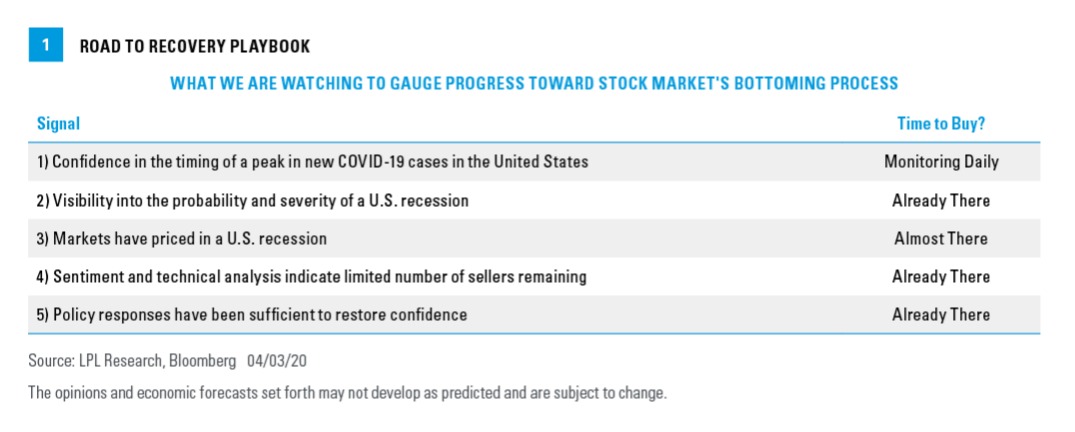
The likelihood that the worst of the crisis in Europe may have passed offered some reassurance last week. In the United States, we hope some evidence emerges over the next couple of weeks that containment efforts have started flattening the curve, but we just don’t know if it will come that quickly. Epidemic models suggest cases may peak in the United States sometime in mid-April, but we will have to wait and see. Gaining a sense for the timing of a peak is one of the remaining pieces of our Road to Recovery Playbook that may signal a durable market bottom can be established [Figure 1].

With stocks now about 10% off their recent lows, we have downgraded signal #3. In our view, a full blown recession was priced into markets in late March, when the S&P 500 Index closed 34% off its February 19 record high. However, in the short term, the risk-reward is not as attractive right now with the index down about 27% from its highs, and the worst of the crisis not yet in view.
MORE RECESSION EVIDENCE
While a recession may no longer be fully priced into the stock market, it has clearly arrived. On April 2, we had another glimpse into just how devastating COVID-19’s blow to the US economy has been when the jobless claims report showed that about 6.6 million people filed for unemployment insurance during the week ending March 28, bringing the two-week total to roughly 10 million. That means about 6% of the US working population has lost their jobs in two weeks, and it likely will bring the unemployment rate near the peak levels of the 2008– 09 financial crisis of over 10%. Friday’s payroll employment report, which ended the record 113-month streak of job gains, is less timely, so that expected surge will be reported next month.
For those thinking about the possibility of a depression, we would point out that the Great Depression was caused by significant policy errors. Monetary, fiscal, trade, and regulatory policies all went in the wrong direction to turn a recession into a depression.
Today, the policy response has been a series of “bazookas,” all aimed in the right direction. We have massive fiscal stimulus ($2 trillion and counting) on top of zero interest rates, unlimited bond purchases, and a series of lending backstops by the Federal Reserve (Fed). Trade restrictions are easing, with some tariff payments likely to be deferred. US companies are also getting some regulatory relief. For example, the Fed eased leverage rules for banks to free up more capital for lending and to help support the economy during the crisis.
SNAPBACK OR RETEST?
In first quarter 2020, the S&P 500 tumbled 20% during its worst first quarter ever and its worst quarter since 2008. As a result, contrarian investors are asking what a large decline in the first quarter may mean for the rest of the year. Looking back to the Great Depression, we found there were six other years in which the S&P 500 lost 10% or more in the first quarter. In five of those six years, the index rose in the subsequent three quarters, with the average gain a staggering 39.4%. We aren’t expecting that type of a gain through 2020 year-end, but this analysis shows that we should be open to a potential second-half-of-the-year rally after the virus is contained.
History also tells us that after massive sell-offs, there have tended to be retests of those lows. The year 1987 is known for the stock market crash in October, but the actual S&P 500 lows didn’t occur until December of that year, after a nearly 15% rally failed. Another major low took place in October 2002, only to be tested again in March 2003. Lows occurred in October 2008, and then a 27% bounce took place late in 2008, to be followed by the ultimate lows in March 2009. Reaching the market “bottom” in a recession is a process, with many ups and downs along the way. Although we think we may be close, there could be more pain before we reach the ultimate lows in this cycle.

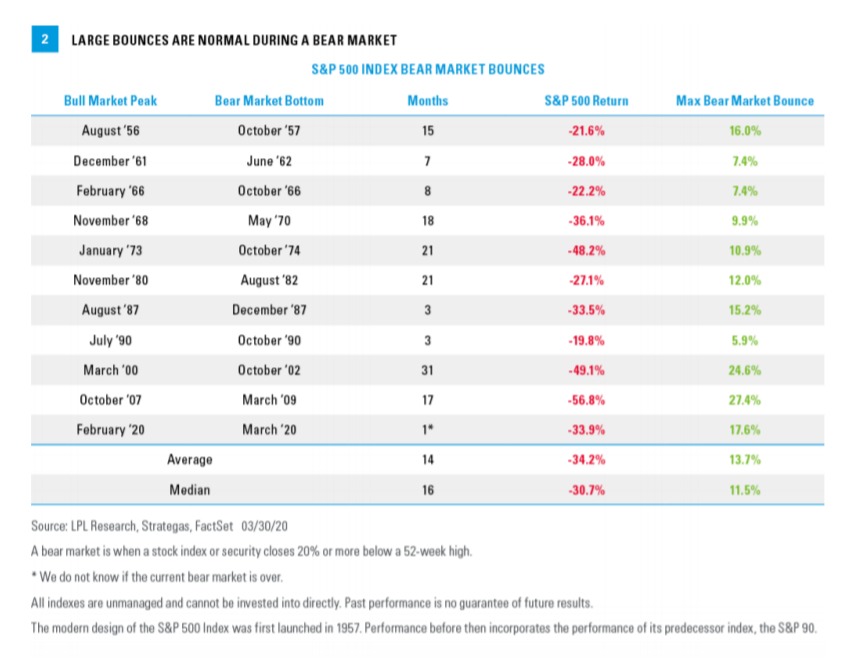
We looked at the nine bear markets that have taken place since 1950, and we found the S&P 500 had an average maximum bounce of about 14% along the way [Figure 2]. Incredibly, during the tech-bubble bear market of the early 2000s, we found six separate 10% bounces along the way, before the ultimate low of 49.1% below the previous high. We hope this helps put into context the S&P 500’s 17% three-day rally March 24–26. The sharpest rallies historically have taken place during bear markets, and although that recent bounce was a welcome reprieve, investors should keep in mind it may have been a bear market rally, and recent gains may not hold.
WHERE DO WE GO FROM HERE?
Although we don’t have clear sight into a peak in the number of COVID-19 cases yet, we continue to believe that suitable long-term investors may want to consider more equity exposure in their portfolios where appropriate. Though we don’t know if the late-March lows will hold, we believe they are in the range of an eventual durable low
If we make the assumption that we may have a good idea what the impact of this crisis may be a couple of weeks from now—both in terms of the tragic loss of human life and the duration of the economic shutdown— then the S&P 500 lows may be in. If new cases continue a steady upward climb, and markets price in more incremental damage to the economy and a more delayed recovery, the March lows may not hold.
For more tactical investors, we continue to suggest patience as the crisis develops. A more attractive entry point may present itself soon. We will continue to follow our Road to Recovery Playbook to gauge progress on the market’s bottoming process.
Click here to download a PDF of this report.
IMPORTANT DISCLOSURES
This material is for general information only and is not intended to provide specific advice or recommendations for any individual. There is no assurance that the views or strategies discussed are suitable for all investors or will yield positive outcomes. Investing involves risks including possible loss of principal. Any economic forecasts set forth may not develop as predicted and are subject to change.
References to markets, asset classes, and sectors are generally regarding the corresponding market index. Indexes are unmanaged statistical composites and cannot be invested into directly. Index performance is not indicative of the performance of any investment and do not reflect fees, expenses, or sales charges. All performance referenced is historical and is no guarantee of future results.
All information is believed to be from reliable sources; however LPL Financial makes no representation as to its completeness or accuracy. Please read the full Outlook 2020: Bringing Markets Into Focus publication for additional description and disclosure.
This research material has been prepared by LPL Financial LLC.
Securities and advisory services offered through LPL Financial (LPL), a registered investment advisor and broker-dealer (member FINRA/SIPC). Insurance products are offered through LPL or its licensed affiliates. To the extent you are receiving investment advice from a separately registered independent investment advisor that is not an LPL affiliate, please note LPL makes no representation with respect to such entity.
If your financial professional is located at a bank or credit union, please note that the bank/credit union is not registered as a brokerdealer or investment advisor. Registered representatives of LPL may also be employees of the bank/credit union. These products and services are being offered through LPL or its affiliates, which are separate entities from, and not affiliates of, the bank/credit union. Securities and insurance offered through LPL or its affiliates are:
Not Insured by FDIC/NCUA or Any Other Government Agency | Not Bank/Credit Union Guaranteed | Not Bank/Credit Union Deposits or Obligations | May Lose Value
Tracking # 1-977716 (Exp. 04/21)
