Heightened volatility and uncertainty in both financial markets and the broader economy present challenges and opportunities for investors. Understanding the fundamental differences between the strategic and tactical investment horizons through which an investor can face these challenges and approach these opportunities is essential for navigating these complex environments. Like the more predictable rhythm of ocean tides, strategic investing focuses on longer-term expectations, while a tactical approach responds to short-term market conditions, akin to unpredictable surges and waves on the seas. The annual release of our updated strategic asset allocation provides an opportunity to explore the distinct nature of these investment horizons and examine when and why our strategic and tactical perspectives may diverge, despite sharing the same ultimate objective — delivering a performance in excess of the benchmark over the target time horizon.
Strategic and Tactical: Different Investment Drivers for Different Time Horizons
The effective alignment of the likely time horizon of investment drivers and the desired model investment time horizon, strategic or tactical, continues to be a cornerstone of effective portfolio management. The LPL Research Strategic and Tactical Asset Allocation Committee (STAAC) considers our strategic views to have around a three-to five-year horizon, resembling the predictable, cyclical nature of ocean tides — following a steady course while ignoring short-term disturbances and gyrations. Much like the captain of a cruise ship ignoring smaller waves while looking far out into the distance to the horizon, this approach prioritizes longer-term market drivers and fundamentals, patiently waiting for investment theses to materialize, sometimes over several years.
Strategic allocations inherently require patience, but this doesn’t mean they remain static indefinitely. LPL Research typically reviews its Strategic Asset Allocation (SAA) annually, aligning with updates to our Capital Market Assumptions (CMA). These updates can reflect meaningful shifts in long-term return drivers, structural changes in macroeconomic conditions, or evolving asset class characteristics. LPL Research evaluates asset classes for sensitivity to many factors, which may influence the expected returns of equities, fixed income, diversifying strategies, and cash over a strategic investment horizon, including economic growth, inflation, interest rates, business cycle, valuations, fundamentals, geopolitical risk, volatility, and dispersion.
Valuations play a particularly critical role in this framework, as historically they have demonstrated a high correlation with long-term market performance. The price-to-earnings ratio (P/E) for the S&P 500 Index, for example, has shown predictive power for subsequent decade-long returns, with higher P/Es typically preceding weaker long-term performance and lower P/Es often followed by stronger results.
Stock Valuations Have Been Good Predictors of Long-Term Returns
Relationship between S&P 500 price-to-earnings ratio and future 10-year performance is strong
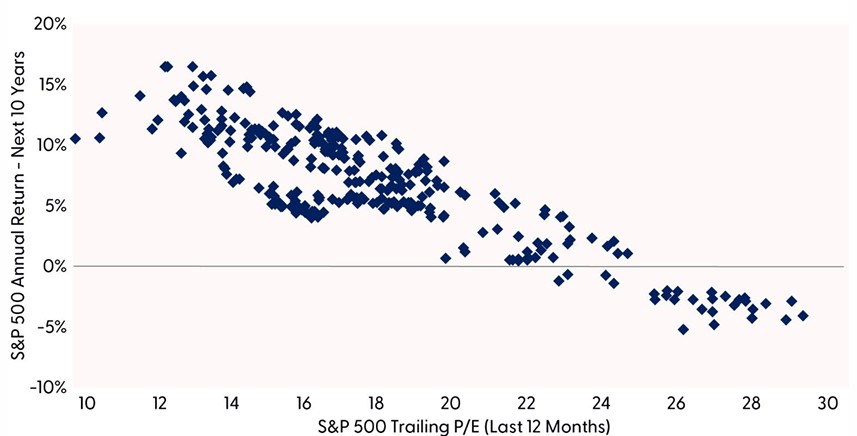
Source: LPL Research, FactSet 03/05/25 (Data from 1991 to Present)
Disclosures: Indexes are unmanaged and cannot be invested in directly.
Past performance is no guarantee of future results.
Conversely, a Tactical Asset Allocation (TAA) operates in a more dynamic environment, responding to short-term market conditions, much like sailors adjusting their course to navigate changing winds and waters. Like a sailor who is heading north may adjust sails to veer east or west to pick up strong winds or avoid turbulent waters, our TAA process is managed more actively, seeking to capitalize on timely market trends and fluctuations by making adjustments based on technical analysis and current market fundamentals. The STAAC considers a tactical time horizon to typically span anywhere from three months to around a year. Tactical decisions place less emphasis on valuations, which have demonstrated limited predictive power over shorter periods. Instead, tactical positioning incorporates technical analysis and immediate market conditions, allowing for more frequent and timely adjustments as both opportunities and risks emerge. We publish our tactical views monthly in our Global Portfolio Strategy report, but they are modified more frequently when market conditions warrant immediate action.
Valuations Often Don’t Revert to Mean Within a Tactical Time Horizon
Relationship between S&P 500 price-to-earnings ratio and future one-year performance is weak
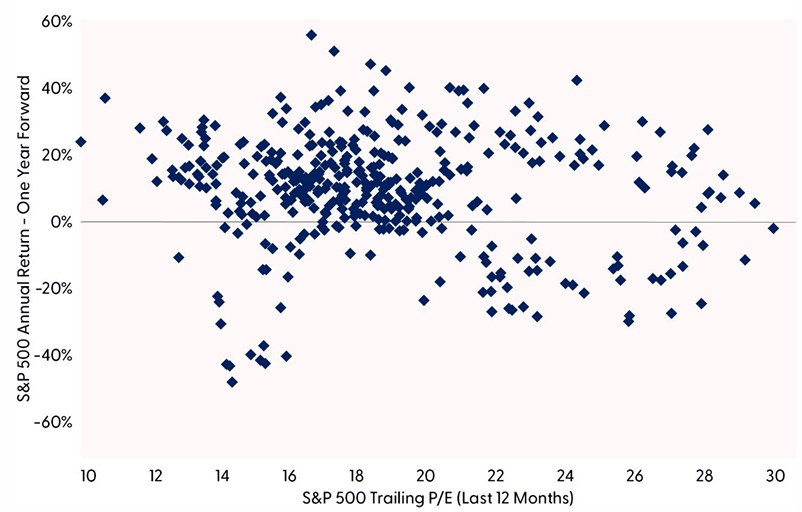
Source: LPL Research, FactSet 03/05/25
Disclosures: Indexes are unmanaged and cannot be invested in directly. Past performance is no guarantee of future results.
When Strategic and Tactical Views Diverge
Because strategic and tactical approaches respond to different market drivers and operate on distinct time horizons, they occasionally suggest contradictory positioning despite sharing the same destination of seeking excess performance relative to investment benchmarks. This apparent paradox makes perfect sense when we consider their complementary nature. While strategic allocations may favor an asset class with attractive long-term valuation metrics, tactical considerations might temporarily lead to an underweight based on near-term catalysts or weak technicals.
For example, our strategic outlook maintains a positive view on emerging market equities based on relatively attractive valuations, leading to an increasingly favorable risk-reward profile and lower correlations to U.S. equities. Simultaneously, our tactical view is underweight the same asset class despite low valuations. The STAAC remains tactically cautious due to lackluster growth in China, heightened trade tensions, and elevated geopolitical risk in Asia and the Middle East. Improving technicals are a possible catalyst for a change to this tactical view. Both the overweight and underweight perspectives can be valid within their respective time frames, much like how two vessels might take different routes to the same harbor depending on immediate weather conditions versus seasonal patterns and where they expect to stop along the way.
Some other asset class views also diverge depending on the time horizon through which they are considered. Large cap growth equities were recently upgraded, and small cap value downgraded to underweight by the STAAC on a tactical basis. Our fundamental and technical quantitative analysis of these asset classes informed these tactical decisions. On a strategic basis, however, we recently decreased exposure to growth-oriented equities (both large and small) reflecting valuations that in a historic context are increasingly stretched relative to value-oriented equities.
Again, while these views may diverge from each other over a tactical time horizon, they can still be congruent with each other given their distinct time horizons. The strategic thesis may have a shorter-term drawdown on this decision if the tactical thesis comes to fruition, but over the more strategic time horizon we would expect the increased impact of valuations to make up for that. The tactical model, on the other hand, may use its ability to move nimbly overweight and underweight these asset classes multiple times over the strategic time frame, with the aim of exploiting these shorter-term misalignments in value and stitching tactical decisions together with the aim of delivering outperformance over the longer term as well. This tactical approach, however, takes a more in-depth analysis of all the moving and constantly evolving pieces of the puzzle in an attempt to add alpha through more frequent active management of the allocations.
LPL Research Strategic Asset Allocation, Growth with Income (GWI) (60/40)
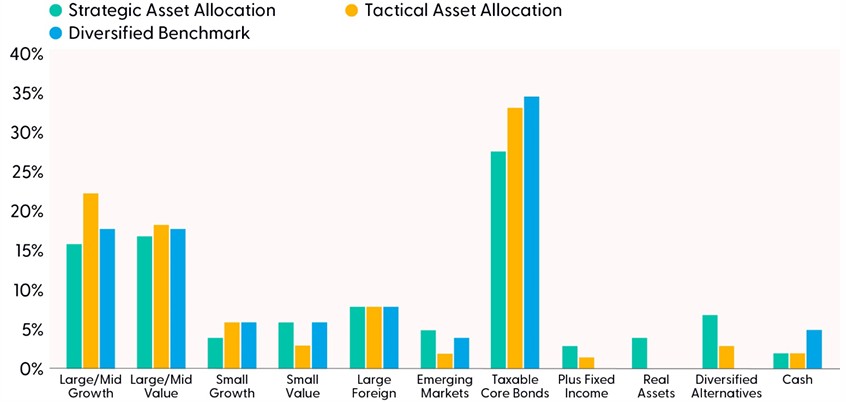
Source: LPL Research, FactSet 03/05/25
Strategic Asset Allocation: A Time to Reduce Risk
LPL Research’s recently released SAA and CMA report aims to act as guiding stars to navigate the markets. Our approach blends a structured analytical approach, including quantitative modeling techniques, with qualitative overlays of strategic insights and inputs from the LPL Research STAAC. Like skilled sailors combining the use of state-of-the-art navigation with the wisdom that a seasoned crew can bring in seeing the subtle signals on when a storm is brewing, and more importantly, what to do next.
The risk-reward tradeoff for stocks is increasingly challenged. Even after a bond rally in the fourth quarter of last year, interest rates, as measured by the 10-year Treasury yield, are relatively higher than they were a year ago, leading to an equity risk premium (ERP) below zero, and the risk of upward pressure on global bond yields remaining. Comparing the ERP to the long-term historical average suggests stocks have dropped below fair-value relative to bonds for the first time in nearly two decades. The STAAC continues to expect below-average economic growth over the next few years due to structural factors (e.g., slow population growth, deficit spending, and the increased cost of debt) and does not anticipate inflation falling quickly back to the Federal Reserve’s (Fed) target rate.
Stock Valuations Fall Below Parity with Bonds at Higher Interest Rate Levels
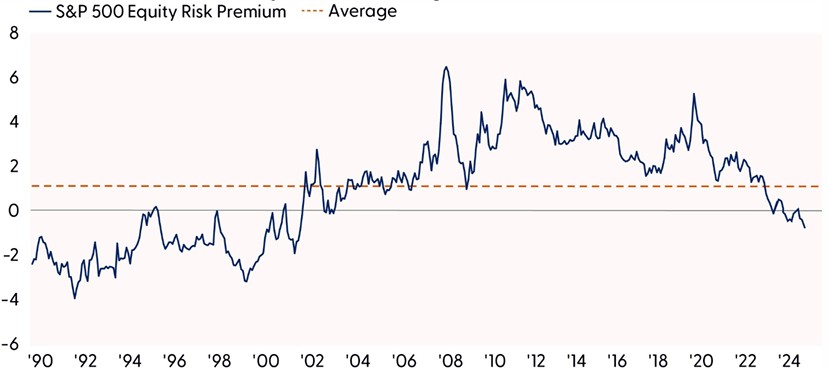
Equity risk premium offers investors little compensation for taking on equity risk
Source: LPL Research, Bloomberg 03/05/25
Disclosures: Indexes are unmanaged and cannot be invested in directly.
Past performance is no guarantee of future results.
S&P 500 equity risk premium is the S&P 500 earnings yield (earnings divided by price) minus the U.S. 10-year Treasury yield.
As a result of these strategic concerns in the recent SAA update, LPL Research reduced both portfolio risk and exposure to traditional asset classes. The risk-reward trade-off for both stocks and bonds has been challenged by a slow growth environment (relative to history), elevated inflation, and a “higher-for-longer” interest rate outlook. The expansion of equity multiples observed in 2024 further exacerbates this situation.
Akin to the sails that can drive a ship forward in good times but can become a liability in a storm, we advise strategic investors to trim equities, especially growth-oriented stocks that have become increasingly expensive relative to history. In prior years, we talked about core fixed income, and specifically nominal Treasuries being a sturdy anchor that can prevent drifting off course in turbulent waters. But recently, we believe that anchor has lost some of its effectiveness. Less stable stock-bond correlation assumptions than realized historically and expectations that longer-duration fixed income may not offer significant protection in ordinary financial market corrections, have led us to look to other less correlated asset classes to dampen portfolio volatility.
As such, we increased exposure to off-benchmark asset classes and diversifying strategies — real assets to hedge elevated inflation expectations over a long-term 3–5-year investment horizon via a diversified basket of commodities, global listed infrastructure, and short-duration Treasury Inflation- Protected Securities (TIPS). Alternative investments were also added to hedge potential volatility, and market concentration risks via a diversified basket of multi-strategy, global macro, and managed futures strategies.
We believe these diversifying strategies can act as versatile sails in changing winds or stabilizers in very rough seas, helping to navigate an uncertain environment. The continued shift towards less market-sensitive strategies aims to enhance portfolio resilience in the face of potential inflation and economic surprises in the months and years ahead.
Tactical Asset Allocation Insights
While our strategic allocation provides a sturdy foundation for long-term portfolio construction, our tactical views address the more immediate investment landscape. Currently, our TAA positioning reflects several near-term considerations that may not significantly impact long-term strategic allocations but are relevant for positioning over the next three to 12 months.
The STAAC maintains its tactical neutral stance on equities based on steady economic growth, solid corporate profits, a supportive Fed, and potential deregulation tailwinds. Stretched valuations and sentiment present risk, so gains in 2025 may be modest.
The STAAC recently upgraded large growth and downgraded small value, on a tactical basis informed by LPL Research’s quantitative and technical analysis work. Large growth continues to enjoy superior cash flow growth and earnings power. The lesser quality, more interest rate sensitive aspect of small cap value stocks outweighs attractive valuations for now.
The STAAC’s tactical regional preference remains U.S. over developed international and emerging markets, due largely to superior domestic earnings and economic growth. Trade and tariff risk remain concerns for emerging market equities, but technicals have been improving, and European stocks have also exhibited relative strength recently.
In fixed income, the STAAC maintains a tactical neutral interest rate sensitivity (duration) profile and recommends an up-in-quality approach in allocating to fixed income sectors. We recommend a tactical underweight to investment-grade corporate bonds, but we think there is an opportunity to invest in shorter to intermediate maturity corporate securities without taking on elevated levels of interest rate or credit risk. This underweight position funds a tactical overweight to preferred securities that remains even though we did recently reduce the size of the overweight.
Similarly to the SAA, the TAA has an out-of-benchmark allocation to alternative investments, specifically global macro strategies. We believe these types of strategies may serve as a solid portfolio diversifier that deserves a steady allocation in case of a stormy outlook, providing ballast through diversification as the market moves on from directional structural themes to more balanced tactical themes.
Conclusion: Integrating Strategic and Tactical Approaches
While strategic investing provides more stability and long-term orientation similar to predictable tidal patterns, tactical investing offers responsiveness to short-term opportunities and risks like the ever-changing sea. By understanding the different drivers behind strategic and tactical decisions, investors can better appreciate why recommendations may occasionally diverge between these frameworks, even as they share the same ultimate objective of providing returns in excess of benchmarks.
Both approaches have distinct merits, and an investment strategy that combines both can be particularly effective, allowing investors to ride the steady waves of strategic investing, while also navigating the choppy waters of tactical investing. By recognizing the complementary nature of strategic and tactical approaches — each responding to different market drivers and operating on distinct timeframes — investors can build resilient portfolios capable of navigating both long-term tides and short-term waves.
LPL Research’s 2025 SAA update steers investors towards a course of reducing risk and increasing exposure to a diversifying basket of real assets and alternative investments, while our tactical view leans more into technical analysis and fundamentals to recommend an overweight to large cap growth stocks.
LPL clients can speak to their financial advisor about implementing these insights through LPL Research’s tactical and strategic models that are available on our managed account platforms, including Model Wealth Portfolios (MWP), Strategic Asset Management (SAM/SWM), and Optimum Model Portfolios (OMP). These platforms offer flexibility to emphasize either strategic alignment, tactical positioning, or a balanced combination of both approaches, tailored to individual investment objectives and risk tolerances.
Important Disclosures
This material is for general information only and is not intended to provide specific advice or recommendations for any individual. There is no assurance that the views or strategies discussed are suitable for all investors or will yield positive outcomes. Investing involves risks including possible loss of principal. Any economic forecasts set forth may not develop as predicted and are subject to change.
References to markets, asset classes, and sectors are generally regarding the corresponding market index. Indexes are unmanaged statistical composites and cannot be invested into directly. Index performance is not indicative of the performance of any investment and do not reflect fees, expenses, or sales charges. All performance referenced is historical and is no guarantee of future results.
Any company names noted herein are for educational purposes only and not an indication of trading intent or a solicitation of their products or services. LPL Financial doesn’t provide research on individual equities.
All information is believed to be from reliable sources; however, LPL Financial makes no representation as to its completeness or accuracy.
All investing involves risk, including possible loss of principal.
US Treasuries may be considered “safe haven” investments but do carry some degree of risk including interest rate, credit, and market risk. Bonds are subject to market and interest rate risk if sold prior to maturity. Bond values will decline as interest rates rise and bonds are subject to availability and change in price.
The Standard & Poor’s 500 Index (S&P500) is a capitalization-weighted index of 500 stocks designed to measure performance of the broad domestic economy through changes in the aggregate market value of 500 stocks representing all major industries.
The PE ratio (price-to-earnings ratio) is a measure of the price paid for a share relative to the annual net income or profit earned by the firm per share. It is a financial ratio used for valuation: a higher PE ratio means that investors are paying more for each unit of net income, so the stock is more expensive compared to one with lower PE ratio.
Earnings per share (EPS) is the portion of a company’s profit allocated to each outstanding share of common stock. EPS serves as an indicator of a company’s profitability. Earnings per share is generally considered to be the single most important variable in determining a share’s price. It is also a major component used to calculate the price-to-earnings valuation ratio.
All index data from FactSet or Bloomberg.
This research material has been prepared by LPL Financial LLC.
Securities and advisory services offered through LPL Financial (LPL), a registered investment advisor and broker dealer, member FINRA/SIPC. To the extent you are receiving investment advice from a separately registered independent investment advisor that is not an LPL affiliate, please note LPL makes no representation with respect to such entity. If your advisor is located at a bank or credit union, please note that the bank/credit union is not registered as a broker-dealer or investment advisor. Registered representatives of LPL may also be employees of the bank/credit union. These products and services are being offered through LPL or its affiliates, which are separate entities from, and not affiliates of, the bank/credit union.
Not Insured by FDIC/NCUA or Any Other Government Agency | Not Bank/Credit Union Guaranteed | Not Bank/Credit Union Deposits or Obligations | May Lose Value
For public use.
Member FINRA/SIPC.
RES-0003080-0225
Tracking #706638 | #706677 (Exp. 03/26)