2020 has been a year of records, both record losses and record gains. After a brutal spring, markets and the economy have mostly rebounded in the summer and fall. We take a closer look at October 26’s record gross domestic product (GDP) report, which may have implications for the upcoming presidential election.
RECORD GROWTH IN THE THIRD QUARTER
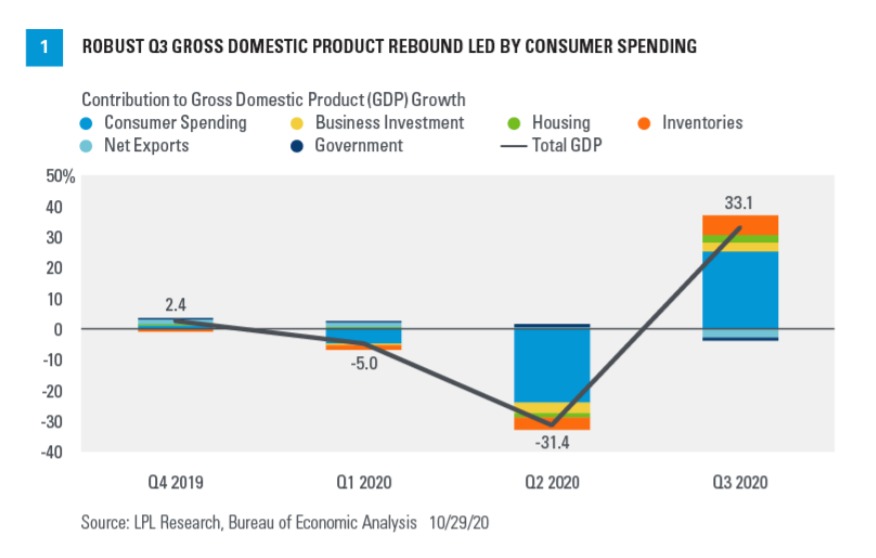
The outbreak of COVID-19 and the subsequent lockdowns triggered the largest quarter-over-quarter decline in GDP since WWII, so perhaps it comes as no surprise that the following quarter tallied the sharpest rebound in that same time period. GDP grew 33.1% annualized in the third quarter, ahead of Bloomberg consensus estimates of 32% and reversing much of the economic fallout stemming from COVID-19 related lockdowns. The largest segment of the US economy—consumer spending— rebounded in a big fashion, while business investment and inventories also helped fuel the surge in growth [Figure 1 . Residential investment also gained momentum in the third quarter, driven by pent-up demand, the work-from-home trend, and historically low mortgage rates.

THE CONSUMER EMERGES FROM LOCKDOWN
Consumer spending comprises roughly 70% of the US economy, so the imposition of stay-at-home orders that limited consumer activity was the primary driver of the contraction in GDP in the second quarter. As these restrictions were lifted, pent-up consumer demand carried over into the third quarter, rebounding in a big way relative to the contraction of the second quarter [Figure 2].
However, the “tale of two economies” remains evident in consumer spending trends. In particular, spending on goods has outpaced spending on services. In the September release of personal consumption expenditures, goods spending grew by 2.2% month over month, while services spending grew by a softer 0.8%, highlighting the bifurcation. Further, the timing of aggregate consumer spending was primarily concentrated at the beginning of the quarter, and momentum began to wane as the effects of fiscal stimulus subsided and a resurgence in COVID-19 cases weighed on growth.
As of October 30, the Atlanta Federal Reserve GDPNow forecasting model predicts GDP to grow at a tepid 2.2% annualized rate for the fourth quarter—certainly nothing to scoff at but clearly indicating slowing growth ahead. Regardless of the state of economic momentum, it is remarkable that GDP is only about 3.5% from recovering the entire pandemic losses only one quarter after the biggest contraction ever recorded. The resilience of US consumers is the top story of the recovery, even with support from historic fiscal stimulus.
MIXED ELECTION SIGNALS
Various polls show former Vice President Joe Biden in the lead in the 2020 presidential race, although the race appears to be tight in certain swing states. We can often look to the market and the economy to help filter out the noise of polling data and the media hype surrounding an election, but 2020 is shaping up to be a tough year to crack. As we noted in the October 26 Weekly Market Commentary: Are the Polls Wrong Again? several market and economic indicators are sending conflicting signals about who may win the election.

Indicators such as a weak US dollar and rising incomes are suggestive of an incumbent party victory, and the average of GDP growth in the second and third quarters of election years can have predictive power for who wins the election—with stronger growth favoring incumbents. That huge GDP number could help President Donald Trump on the margin as it reflects the economy’s strong momentum, but it remains to be seen if voters will discount the performance of the economy given the strong roll stimulus has played. We would also point out that recessions close to elections have historically favored challengers, creating conflicting market signals going into Election Day.
LPL RESEARCH’S CONCLUSION
While the economy has recovered much of the lost output due to the impacts of the COVID-19 outbreak, several areas are still recovering, and the latest COVID-19 outbreak threatens to slow the pace of growth in the fourth quarter. Unemployment remains persistently high, and the waning effects of fiscal stimulus have slowed overall momentum in the economy. While some recent trends in the market and the economy may suggest an incumbent victory, others are pointing in the other direction, while the unusual circumstances this year may limit the reliability of these historical indicators. Whatever the outcome, our political and economic systems are resilient and will adapt. On the eve of the election, we encourage everyone to vote.
Click here to download a PDF of this report.
IMPORTANT DISCLOSURES
This material is for general information only and is not intended to provide specific advice or recommendations for any individual. There is no assurance that the views or strategies discussed are suitable for all investors or will yield positive outcomes. Investing involves risks including possible loss of principal. Any economic forecasts set forth may not develop as predicted and are subject to change.
References to markets, asset classes, and sectors are generally regarding the corresponding market index. Indexes are unmanaged statistical composites and cannot be invested into directly. Index performance is not indicative of the performance of any investment and do not reflect fees, expenses, or sales charges. All performance referenced is historical and is no guarantee of future results.
Any company names noted herein are for educational purposes only and not an indication of trading intent or a solicitation of their products or services. LPL Financial doesn’t provide research on individual equities.
All information is believed to be from reliable sources; however, LPL Financial makes no representation as to its completeness or accuracy.
US Treasuries may be considered “safe haven” investments but do carry some degree of risk including interest rate, credit, and market risk. Bonds are subject to market and interest rate risk if sold prior to maturity. Bond values will decline as interest rates rise and bonds are subject to availability and change in price.
The Standard & Poor’s 500 Index (S&P500) is a capitalization-weighted index of 500 stocks designed to measure performance of the broad domestic economy through changes in the aggregate market value of 500 stocks representing all major industries.
The PE ratio (price-to-earnings ratio) is a measure of the price paid for a share relative to the annual net income or profit earned by the firm per share. It is a financial ratio used for valuation: a higher PE ratio means that investors are paying more for each unit of net income, so the stock is more expensive compared to one with lower PE ratio.
Earnings per share (EPS) is the portion of a company’s profit allocated to each outstanding share of common stock. EPS serves as an indicator of a company’s profitability. Earnings per share is generally considered to be the single most important variable in determining a share’s price. It is also a major component used to calculate the price-to-earnings valuation ratio.
All index data from FactSet. Please read the full Midyear Outlook 2020: The Trail to Recovery publication for additional description and disclosure
This research material has been prepared by LPL Financial LLC.
Securities and advisory services offered through LPL Financial (LPL), a registered investment advisor and broker-dealer (member FINRA/SIPC). Insurance products are offered through LPL or its licensed affiliates. To the extent you are receiving investment advice from a separately registered independent investment advisor that is not an LPL affiliate, please note LPL makes no representation with respect to such entity.
Not Insured by FDIC/NCUA or Any Other Government Agency | Not Bank/Credit Union Guaranteed | Not Bank/Credit Union Deposits or Obligations | May Lose Value
Tracking # 1-05073904 (Exp. 10/21)
